Jeremy Moskowitz, an MVP of Group Policy, showed a demonstration to create a custom view in Event Viewer to trace Group Policy processing of domain group policy objects for a specific user or computer in Teched North America 2014. By default, events are under "Microsoft-Windows-GroupPolicy/Operational" saved all events related to group policy processing for all users and a computer account. It is difficult to trace Group Policy processing for a specific user or computer. To easily trace Group Policy processing for a specific user or computer, administrators have to find the "Activity ID" of a user or computer.
To locate a suitable "Activity ID", we need to understand the behavior of "Activity ID". When a user logs in or a computer updates group policy periodically, a user or a computer will generate a new "Activity ID". administrators should locate an "Activity ID" for troubleshooting.
Goals
To locate a suitable "Activity ID", we need to understand the behavior of "Activity ID". When a user logs in or a computer updates group policy periodically, a user or a computer will generate a new "Activity ID". administrators should locate an "Activity ID" for troubleshooting.
Goals
- Locate "Activity ID" of a user or a computer.
- Create a custom view to trace Group Policy processing
Lab environment
- 1 computer is installed Windows 2012 R2 (Supported operating system: Windows Vista or later)
Lab
1. On a computer, log in as Administrator.
2. Launch "Event Viewer".


7. Select "Event ID 4001".

8. Click "Close".
9. Select "Event ID 4006".
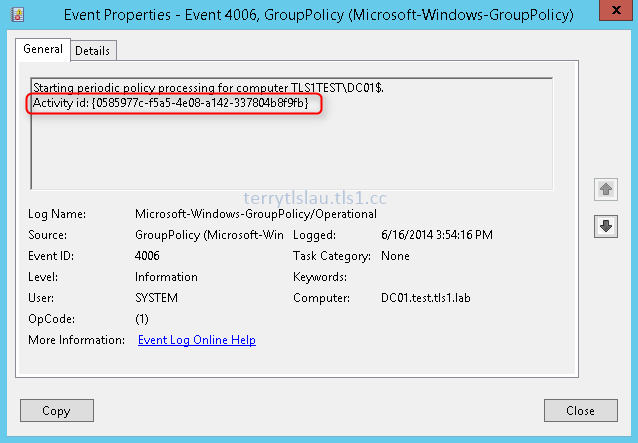
10. Close "Close".
11. Copy the "Activity id" of administrator to a notepad.


14. Check "Edit query manually".


<QueryList><Query Id="0" Path="Application"><Select Path="Microsoft-Windows-GroupPolicy/Operational">*[System/Correlation/@ActivityID='{INSERT ACTIVITY ID HERE}']</Select></Query></QueryList>
Reference:
Troubleshooting Group Policy Using Event Logs
17. Copy the above code and then paste it into the XML pane.
18. Replace "INSERT ACTIVITY id HERE" to the "Activity ID" from a notepad.


20. On "Save Filter to Custom View" window, next to "Name", enter "Administrator GPO tracing".

As a result, all related events of administrator showed in "Administrator GPO tracing".

This posting is provided “AS IS” with no warranties, and confers no rights!
No comments:
Post a Comment